The Office of Inspector General’s (OIG) Information Portal is an interactive data visualization tool that provides the public with an unprecedented means of engaging and understanding City of Chicago data. OIG’s Center for Information Technology & Analytics (CITA) compiles large data sets for statistical models, trends, predictions, and analyses that enable OIG to develop cases, conduct program reviews and audits, and monitor hiring practices. Explore the Information Portal to see dashboards related to the City‘s finances, employees, and public safety.
Tax Increment Financing (TIF) Districts

The TIF District dashboard displays information about TIF Districts, providing annual end-of-year fund balances starting in 2017. The City of Chicago uses TIFs as a special funding tool to promote economic development and public and private investment across the city. Funds are used to build and repair roads and infrastructure, clean polluted land and put vacant properties back to productive use, usually in conjunction with private development projects. Visit our Frequently Asked Questions for help overall with dashboard navigation.
Chicago Fire Department Emergency Events
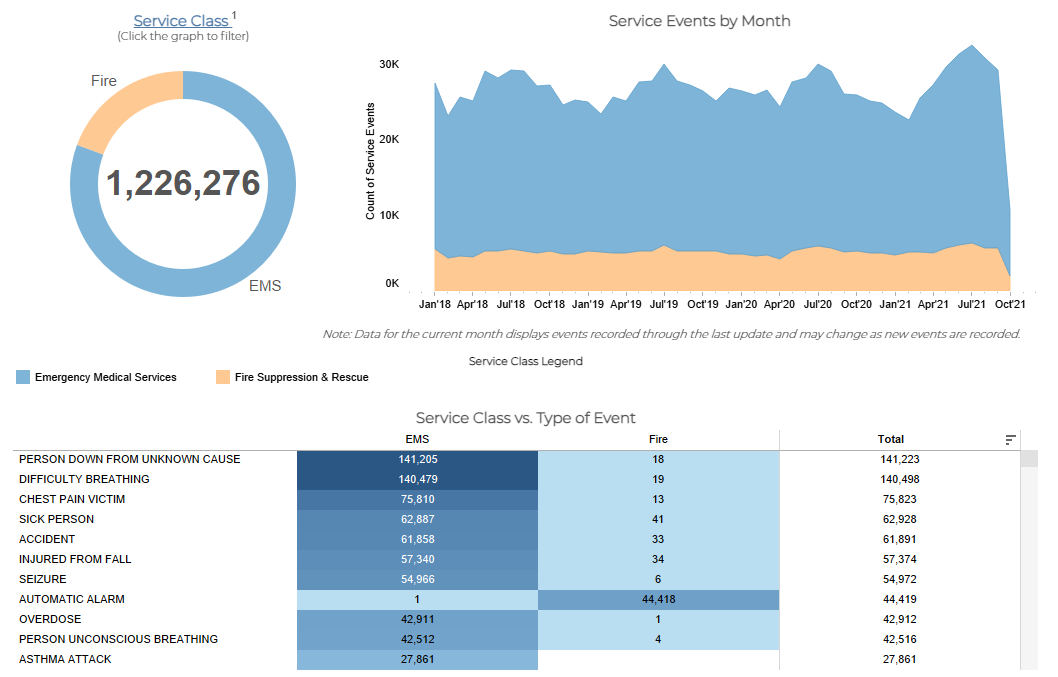
This Emergency Events dashboard displays Office of Emergency Management & Communications data for Chicago Fire Department (CFD) response, displaying emergency service (EMS) events from January 1, 2018 through the present day, with the ability to filter by emergency event types and ward, zip code, or community area. Some significant data findings include:
- Over 80% of requests for CFD response were EMS related, while the remainder were for fire suppression and rescue.
- The most common types of events––accounting for 23% of all events––were “person down from an unknown cause” and “difficulty breathing.”
- The greatest number of events recorded and the highest rate of events per 100,000 people by ward is in the 28th ward and by zip code is 60602, 60603, 60604 (all located downtown); the highest rates of overdose and gunshot related events by community area are found on the West Side, with West and South Side community areas showing the highest rates of gunshot related events per 100,000 people.
Related: OIG’s latest Audit of the Chicago Fire Department’s Fire and Emergency Medical Service Response Times finds that the Fire Department doesn’t implement best practices for evaluating response times and hasn’t corrected previous data concerns.
Levels of Force Used in Tactical Response Reports
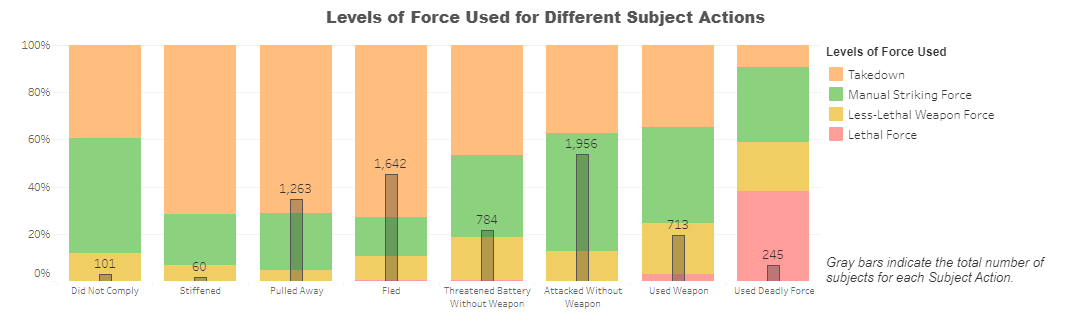
The Tactical Response Reports dashboard displays information on completed Chicago Police Department (CPD) Tactical Response Reports (TRRs), which are forms that must be completed by any CPD member involved in a reportable use-of-force incident. The interactive map shows where these incidents occurred, including demographics and Census data, with a new dataset that allows users to compare the level of force used during an interaction between an individual and a CPD member.
Want to receive updates on new dashboards and reports from OIG? Sign up for our mailing list.
About the Office of Inspector General (OIG)
The mission of the independent and nonpartisan City of Chicago Office of Inspector General is to promote economy, effectiveness, efficiency, and integrity by identifying corruption, waste, and mismanagement in City government. OIG is a watchdog for the taxpayers of the City and has jurisdiction to conduct inquiries into most aspects of City government.
If you see misconduct, mismanagement, or waste, we need to hear from you.
Follow us on LinkedIn, Twitter, Instagram, Facebook, and YouTube for more information on how OIG continues to fight fraud, abuse, and inefficiency in Chicago government.